In the previous post we talked about custom domains, cors, soft delete, shared access signature, file services etc.. We will start this post by talking about Azure CDN or Azure Content Delivery Network.
So far we have been working with the storage account that is created and managed in the West Europe region in Azure and if we are serving images or streaming video content out of that location that is going to be a great experience for people in that region but what if we have users on the other side of the world that need to access content in our storage account. That is where the Azure CDN comes into play.
Let’s say that we have a user up on the top left, he is in US, and he wants to stream some video out of our storage account (nmazuretraining.blob.core.windows.net) that is built in West Europe datacenter. Now accessing that content from the other side of the world isn’t gonna be the greatest experience, so what we can do is we can build an Azure CDN Profile and we can integrate our storage account with the Azure CDN. Idea with CDN is, if you look in the middle of the image below, we have edge servers, so we basically take the content from our storage account and replicate that to Edge Servers in the content delivery network (CDN) that are all over the world and that gives people in other countries fast connectivity to a local server that has a copy of that data.
So to understand this we have a couple of steps:
Arrow 1 : User1 wants to access some content in our storage account, when we integrate our storage account with CDN, that user will actually go to a different endpoint (example nmazuretraining.azureedge.net) something that we would provision, and when User1 hit that infrastructure he would get routed to the closest Edge Server (probably a server in US).
Arrow 2: If that edge server didn’t have the content that user is looking for, edge server will go over to our storage account (Origin Server can be an Azure Web App, Azure Cloud Service, Azure Storage account, or any publicly accessible web server.)
Arrow 3: and our Origin (being our storage account) will send that contant to the edge and then we will have a copy of that data there. Now that data will have a time to live configuration or how long it’ll actually be cached on those Edge Servers (we will see how to configure that a little bit later). If we don’t specify a TTL, the default TTL is 7 days.
Arrow 4: In this step Edge server will cache the file and return the file to the original requestor.
Regarding arrows 5 and 6: the cool thing about this is, if we have another user down at the bottom left that is also in US, once he go to access that same asset out of our storage account, he will be routed to a local data center where he will have a low latency connection and a local copy of that data. So in addition to this first benefit of making the data closer to the user, we’ve also got the ability to kind of scale out requests across a bunch of different Edge Servers, and this is especially useful when you have a global user base, and we can take, you know, all of that load off that single origin and kind of scale it out and distribute it to multiple Edge Servers all around the world.

CDN Limitations:
Each Azure subscription has default limits for the following resources:
- The number of CDN profiles that can be created.
- The number of endpoints that can be created in a CDN profile.
- The number of custom domains that can be mapped to an endpoint.
Let’s see how we can create CDN
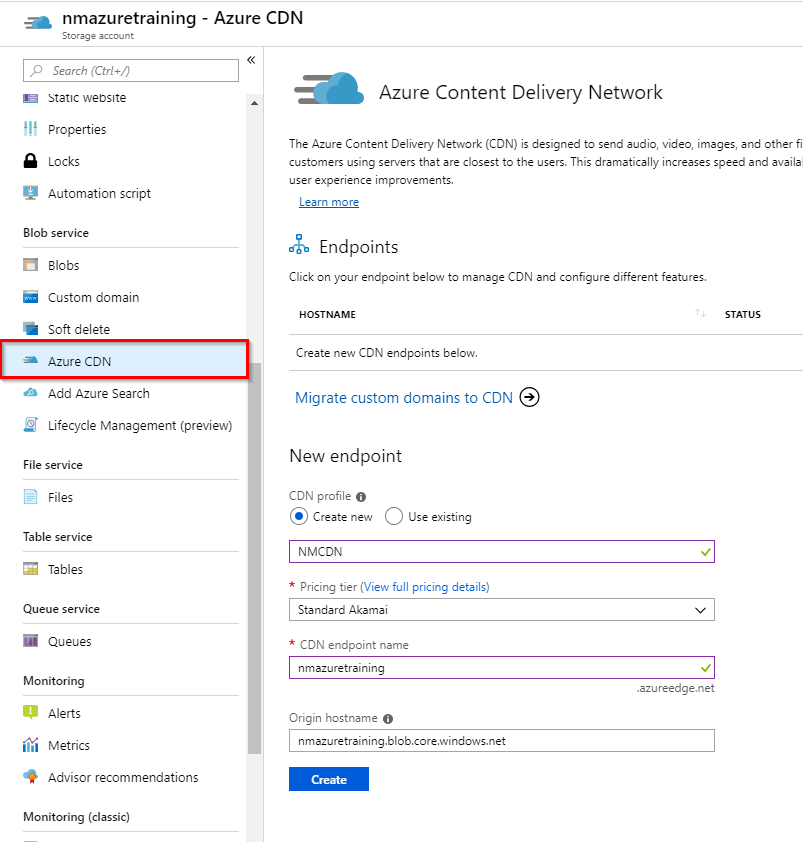
Click on your storage account –> Blob Services –> Azure CDN
First thing we have to do is to create new CDN Profile. This name must be globally unique. I will use NMCDN
Origin Hostname: This is the name of your server from where the CDN endpoint will pull the content. Default option is the name of your storage account. Once done click Create.

Pricing Tier –> Here we have a couple of different tiers and different providers that you need to work with. So Microsoft partners with Verizon and Akamai to distribute the content around the world to all these different data centers and as you can see, there’s a Microsoft Standard, Standard Verizon, a Standard Akamai, and then there’s a premium Verizon. So depending on the actual plan you go with here, that’s of course going to dictate how much you pay per gigabyte up to 10 terabytes.
The big difference between the Standard Verizon and the Standard Akamai is that it can take the Standard Verizon up to 90 minutes before it’ll start caching your content, so you will be waiting around for awhile when you first provision that, while Akamai takes minutes to replicate. For testing purposes I will select Akamai.


After the endpoint is created, it appears in the list of endpoints for the profile.

When we click on it we will be able to manage CDN and configure different features.
ORIGIN
Origin Type: If we need to change origin type, we can do it here. We have 4 option: Storage for Azure Storage, Cloud service for Azure Cloud Services, Web App for Azure Web Apps, Custom origin
Origin Path: Here we can enter the path to the resources that you want to cache, example /My Images. To allow caching of any resource at the domain leave this setting blank.

Custom Domains –> Here we can configure our custom domains, so instead of using this endpoint, nmazuretraining.azureedge.net., we can actually set up something like cdn.company.com by setting up a custom domain here.

Compression –> This will allow us to compress files and by doing this it will improve file transfer speed and increase page-load performance by reducing a file’s size before it is sent from the server. It is enabled by default.

Geo-Filtering –> When a user requests your content, by default, the content is served regardless of the location of the user making the request. However, in some cases, you may want to restrict access to your content by country. With the geo-filtering feature, you can create rules on specific paths on your CDN endpoint to allow or block content in selected countries.

Optimization –> Here we have few option for delivery secenarios.
- General web delivery is the most common optimization option. It’s designed for general web content optimization, such as webpages and web applications. This optimization also can be used for file and video downloads.
- General media streaming is used for live streaming
- Video-on-demand media streaming optimization improves video-on-demand streaming content. The major difference between this optimization type and the general media streaming optimization type is the connection retry time-out. The time-out is much shorter to work with live streaming scenarios.
- Large file download is optimized for content larger than 10 MB. If your average file size is smaller than 10 MB, use general web delivery
- Dynamic site acceleration this optimization involves an additional fee to use. You can use this optimization to accelerate a web app that includes numerous responses that aren’t cacheable. Examples are search results, checkout transactions, or real-time data.

MONITORING
Let’s start this section by talking about Activity Log. The Azure Activity Log is considered a control pane or management log. So its purpose is to provide insight into the operations performed on the resource itself, in this case the storage account. So this includes things like modifying user roles assignments to the storage account, regenerating storage account keys, changing settings, like requiring HTTPS to access the data pane, or modifying tags attached to the storage account. It doesn’t include logging of activities that happen against the data pane, such as uploading or deleting blobs, tables, or queues. Those are considered diagnostic logs, not management logs, and those types of data-related activities are handled by Storage Analytics.

The activity log includes a few different categories of events.
- Administrative Events –> document all the changes to the resource, who made the change, and when. It also includes any changes to the role-based access control assignments to the resource.
- Service Health Events –> This could be incidents in the Azure region, maintenance events, security, and information events. They only appear in the activity log if you have resources in the subscription that would be impacted by the event.
- Recommendations –> Advisor events also show up in the activity log. Azure Advisor analyzes your resource configuration and usage telemetry and recommends ways to improve the cost effectiveness, performance, availability, and security of your resources.
- Security –> This is also part of the Activity logs and these are generated by Azure Security Center
- Custom alerts –> Our own alerts that we create
Azure Storage Analytics
Azure Storage Analytics can log all the operations that occur against your storage account. It logs both the successful requests and the failed ones. So you can see the details of read, write, and delete operations against your blobs, tables, and queues and see the reasons for failed requests, like timeouts, throttling, and authorization errors.
We have classic and we have new monitoring and analytics.

Logging isn’t enabled by default, but you can turn it on for blob, table, and queue storage. Logging is not currently available for file storage. When you enable logging, you can choose whether or not to log reads, writes, and/or deletes, and you enable these options for each of the storage services individually. You also set a retention period for each of the logs.

The logs get stored in a hidden container in your storage account called $logs. This container doesn’t show up if you list all the containers in your storage account, but you can access it directly using tools like Azure Storage Explorer. Within the logs container are subfolders for each of the services you’ve enabled logging for. The subfolders are just part of the URL path to the blobs that hold the logging information, and within the folder structure for each service are the year, month, day, and hour. There can be multiple blobs in each hour folder, and they get incremented with the file extension. log. So they can be accessed through a URI just like any other blob, and the same security constraints apply. The log files are just text files though, and the properties that are stored in each entry within the file are separated by a ; with each entry ending with the newline character.


Keep in mind that log data is still data within your storage account, and you’re charged for storing it, as well as requests to create the blobs for logging and bandwidth charges when logs are downloaded from Azure Storage. So it’s good to set a reasonable retention policy for the data.
METRICS IN AZURE
Azure Storage Analytics collects metrics from Azure Storage to provide you insight into the capacity and usage trends of your storage accounts and also allows you to identify issues and perform analysis on reported problems. Metrics are now enabled by default and are sent to Azure Monitor.
Metrics are made up of two main categories, capacity metrics and transactions metrics.
Capacity Metrics
Storage Analytics records the amount of storage used by the entire storage account, which is the sum of the capacity used by blob, table, file, and queue storage. It also records information about each of the services individually, like the total amount of blob storage, the number of blobs in the storage account, and the number of containers. Capacity metric values are sent to Azure Monitor every hour, and the values are refreshed daily.
Transactions Metrics
Transactions metrics record the number of requests made to a storage service or to a specified API operation within the service. This includes successful and failed requests, as well as requested that produced errors. The amount of ingress data coming into Azure Storage is tracked, as well as the amount of egress data being read from the storage account. Note that this includes data being read within Azure by a client app, so it’s not necessarily a reflection of billable egress bandwidth.
Now what you will see under the Monitoring section is that we have 2 Metrics. One classic and the other one without (classic tag). Metric (classic) –> These are now referred to as legacy metrics, and they’re still available if you enable them but these metrics will be phased out in the future, so it’s good to start migrating to the new metrics.

Click on the Metrics in under Monitoring. So you can choose to view metrics at the account level or scope to one of the storage services.

Let’s just choose the Blob service because I know there’s data stored in there. I can choose to view the total capacity of that service in my storage account. Depending on the metric, there can be different aggregations, like average, min, and max, but we’ve only got the total sum for this one. If I hover over the line at any point, I can see the time below the line, as well as the actual capacity at that instant showing in the bottom left corner.

STORAGE ALERTS
Now that we’ve explored metrics a bit, let’s see how we can set up alerts to notify us when one of the metrics reaches a threshold that we want to know about. I’m still inside the storage account, so I’ll scroll down to the Monitoring section and this time choose Alerts. Let’s create a new alert rule.

Resource –> We do not need to select an resource, because we’re creating the alert within the storage account already.
Condition –> Click on Add condition. There’s a lot we can choose from here. Let’s just set an alert on used capacity in the storage account.

At the bottom, we can set the conditions. So let’s say we want an alert when the capacity is greater than, and we’ll stick with the total amount, and set the threshold to 100 MB (just for this demo). Let’s set the frequency to every hour. Click on Done.

Action Group –> This comes into play when you need to decide what happens when the alert is fired. You can send notifications in a variety of ways. What I really want to show you here is that you can choose between sending emails, sms messages, sending to Azure apps or sending a voice message etc…

Example, when you select Email you will have options to specify email that will receive messages and you can specify phone nr that will get the notifications about storage capacity.


Last to configure is Alert Details, so these will come in the notification.

I will upload some files so that we see how the notification message looks like.

That’s it. I hope you enjoyed and learned something new. Next part will focus on Azure Networks.
Stay Tuned!
Cheers,
Nedim

Leave a comment